

Roof age map: what it can tell you, and what it cannot
A roof age map colours each house by how old its roof is likely to be, and Roof Report Pro's map does that in Florida and Texas, but recorded roof dates cover only a small share of homes, so most filtering leans on year built and roof permit history instead. Here is exactly how that works.
Key Statistics
Key Benefits
Roof age map for roofers in Florida and Texas: see where roof dates come from, how few homes have one, and how year built and permits fill the gap.
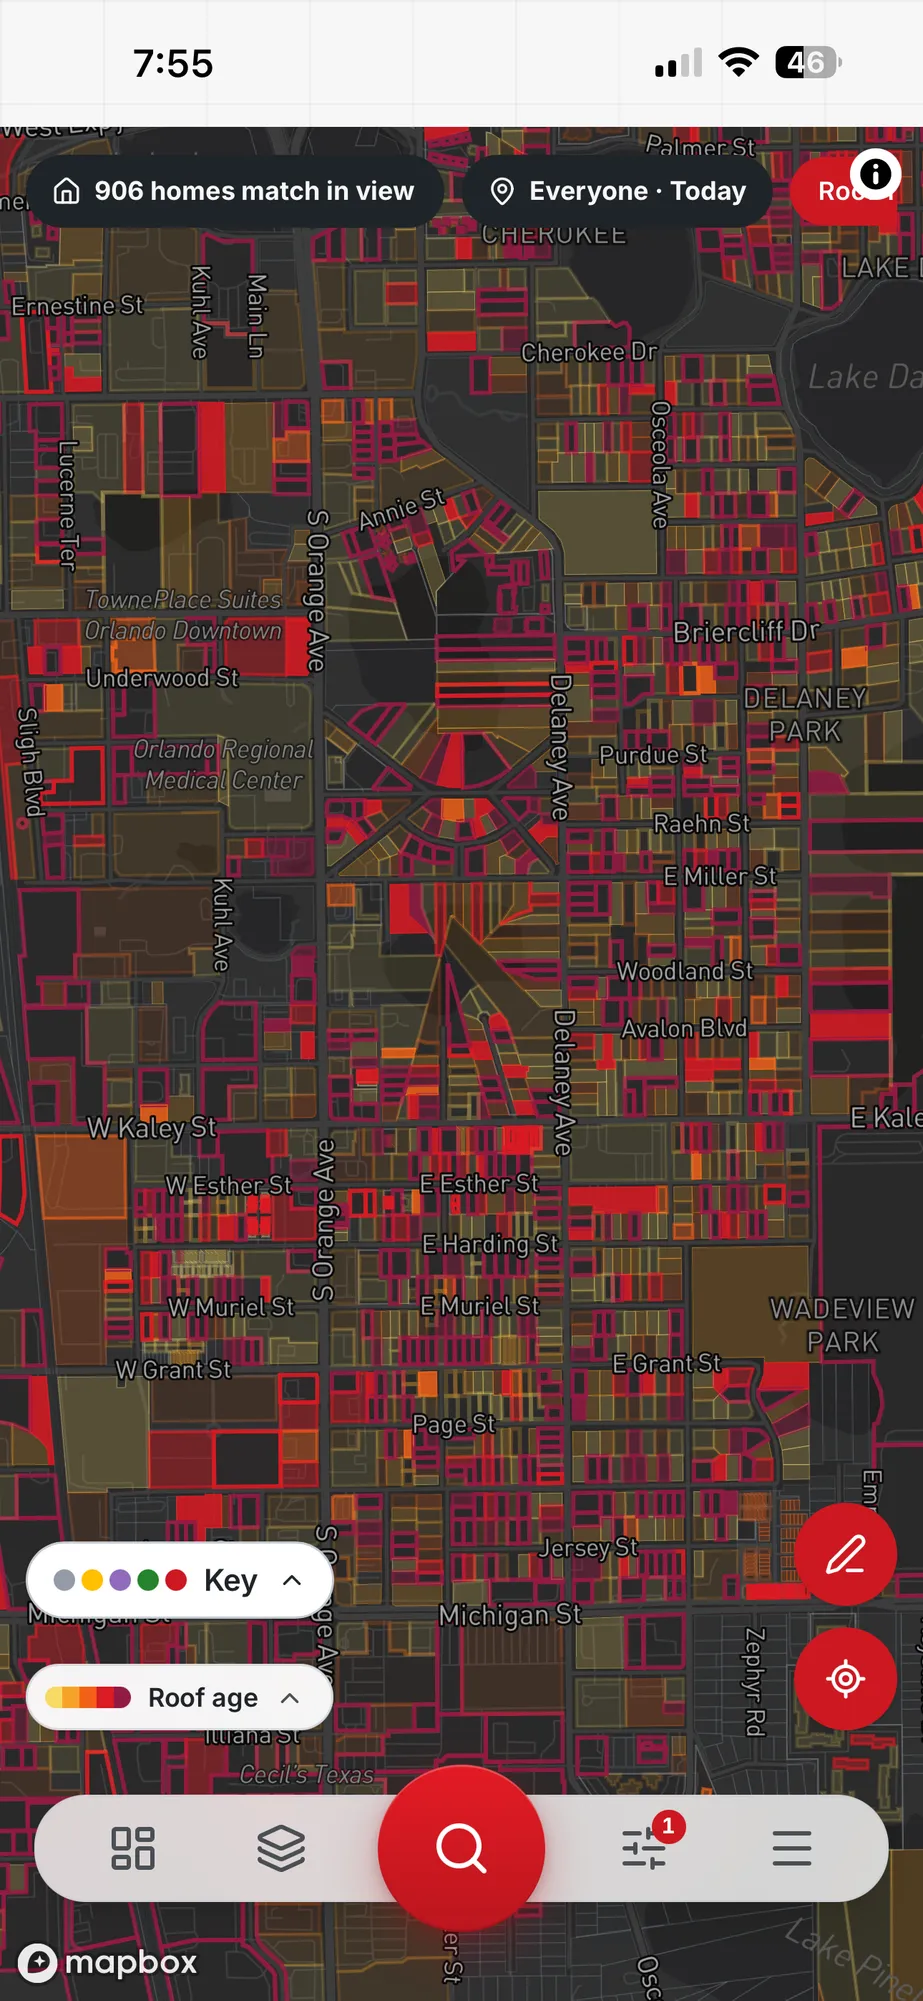
Colour the map by roof age or by home age
Switch the colouring and the same neighbourhood reads two ways: one view follows recorded roof dates, the other follows the year each house was built. Flipping between them shows you right away which streets have solid roof data and which only have a build year.
Filter on 5, 10, 15 or 20 years and up
The roof age filter has four presets. Pick the one that matches your pitch. A crew selling replacements will usually start at 20 years, while a repair-first outfit may start at 10. The filter applies to homes that have a recorded roof date.
Use the permit filters for a roof date you can trace
Two permit filters sit next to roof age: "Has a roof permit" and "Roof date from a permit". The second keeps only homes whose roof date came from a permit record, which is the source you can point to if a homeowner asks where the number came from.
Fall back on year built when there is no roof date
Most houses in the data have no recorded roof year, so the build-year range filter does much of the real work. A 1998 house with no roof permit on file is a different prospect from a 2019 house with one, and you can see that without a roof date at all.
See the count before you drive anywhere
The map shows a live count, "N homes match in view". Zoomed out it says "at least N", and counts under five are withheld. Watching the number fall as you add a filter tells you whether your rule is too tight to be worth a route.
Open one home and read its permits
Tap a house and its panel lists the permits on record along with its storm history. If the roof age filter put the home on your list, the panel is where you check the evidence behind that choice before a rep walks up the driveway.
How the Roof Age Map Works
- 1
Open your county and colour by roof age
Zoom to the area you work in Florida or Texas and choose the roof age colouring. Homes with a recorded roof date take a colour; homes without one stay uncoloured, which shows you the real coverage gaps street by street.
- 2
Click a roof age preset
Choose 5, 10, 15 or 20 years and up from the filter panel. Filters are clicked, not typed, so the rule you applied stays visible on screen and a teammate can see it too.
- 3
Add year built and permit filters
Set a build-year range, then switch on the permit filters. Together they stand in for the roof dates that are missing, and the live count shows how many homes match in view.
- 4
Check a few homes, then send reps
Open a handful of houses and read their permits. If the pattern holds, save the area as a territory and send the team, or export the addresses for the phone.
Real-World Use Cases
See how roofing professionals use this feature in their daily work.
Planning a first week in a new Texas county
Scenario
A sales manager opens a Texas county the company has never worked. Colouring by roof age leaves most of the map blank, because Texas roof dates are rare, so the manager switches to a build-year range of 1995 to 2005 instead.
Outcome
The team starts on a list built from year built, and treats the few coloured homes as a bonus rather than the plan.
Checking a Florida neighbourhood before a door-hanger day
Scenario
A Florida office manager colours a subdivision by roof age and sees a patch of homes with permit-based roof dates from 2008 and 2009. She applies the 15 years and up preset to isolate them.
Outcome
The crew knows which streets hold a documented run of roofs from the same era, and which streets simply have no data.
Skipping homes that were re-roofed lately
Scenario
An owner wants to avoid wasted knocks. He uses the roof permit filter to find houses with a recent re-roof on record and removes them from the territory.
Outcome
Reps spend their evening on houses with no recent roof permit instead of knocking where the work is already done.
Explaining the list to a rep who doubts it
Scenario
A new rep asks why a house is on the list when its roof looks fine from the street. The manager opens the home panel and reads the permit history and the year built.
Outcome
The rep sees the evidence behind the choice, learns that age is a reason to knock and not a verdict, and inspects the roof on its own merits.
Why Choose Roof Age Map for Roofers: What the Data Shows?
| Aspect | With Roof Report Pro | Without |
|---|---|---|
| Where a roof date comes from | A roof permit record, traceable from the home panel | A guess from the street or a homeowner's memory |
| Share of homes with a roof date | A small share: about 2.4 percent overall as of 18 November 2026 | Unknown until someone asks at each door |
| When there is no roof date | Year built range and roof permit filters fill the gap | The house is skipped or visited blind |
| Recently re-roofed homes | Spotted with the roof permit filters | Found out at the door after a wasted conversation |
| How you set the rule | Clicked presets for 5, 10, 15 and 20 years and up | A spreadsheet column you sort and re-sort by hand |
| Where it works | Florida and Texas house data today | Whatever area your last list happened to cover |
What is a roof age map, and what does ours colour?
A roof age map is a street map where each house is shaded by how old its roof is. Roofers use it to decide which doors to knock first, because a roof near the end of its life is the easiest conversation to have. Ours can colour homes by roof age or by home age, and it can filter to roofs at 5, 10, 15 or 20 years and up. The honest caveat comes first, though: the shading depends on a recorded roof date, and most houses do not have one.
Where do roof dates come from?
Roof dates on the map come from permit records. When a county logs a roofing permit, the date of that permit tells us a roof was replaced around then, and the map shows it as the roof date. There is no satellite guesswork behind the number and no homeowner survey. That makes a roof date traceable, because you can open the home and read the permit, but it also explains the gap. A house that was re-roofed without a permit, or whose permit was never digitised by its county, has no roof date at all.
How small is the share of homes with a roof date?
Small, and we would rather you hear it from us than discover it on your first morning. As of 18 November 2026, about 2.4 percent of the roughly 20 million homes in our data carry a roof year. In Florida that is about 4.2 percent, and in Texas about 0.8 percent. If you open a Texas county and colour it by roof age, expect a mostly blank map with a few coloured houses. That is the data being truthful, not the map being broken.
Why do year built and permit history do most of the work?
Year built is far fuller than roof date: about 79 percent of Florida homes and about 50 percent of Texas homes have one. A house built in 1999 that shows no roof permit since is a reasonable candidate for an older roof, even though no one wrote the roof's age down. The year-built range filter and the two permit filters let you describe that house in clicks. This is the approach we suggest for most of your list, with roof age presets used as a sharper cut where the data exists.
How should I read a roof date from a permit?
Read it as a strong clue, not a certificate. A permit date is when the county recorded the work, which can differ from the day the shingles went on. A permit can also cover a partial re-roof or a repair, and the map does not tell you which. Open the home panel to see the permit history, then confirm at the door. If a homeowner tells you something different from the record, believe the homeowner and move on.
Can a roof age map replace an inspection?
No, and it is not meant to. Age tells you where to look first; it does not tell you what is wrong. A roof's condition depends on its material, its installation, the weather it has taken and how it has been maintained. Use the map to pick the houses, then look at the roof. When a visit turns into an inspection, the findings come from what the inspector sees on the roof itself, not from a date on a map.
Which areas can I use it in today?
House data is live in Florida and Texas: 67 Florida counties and 241 Texas counties. Georgia, Alabama and Tennessee are the next states in line, and Louisiana and Oklahoma follow later. If your territory sits outside Florida and Texas, the roof age map has nothing to show you yet, and we would rather say so now than let you find an empty screen after you sign up.
What does a seat cost?
Coverage by state
Florida, Texas
Georgia, Alabama, Tennessee
Louisiana, Oklahoma
None. One seat price whichever states you work.
Frequently Asked Questions
Who Benefits Most
Roof Age Map for Roofers: What the Data Shows is designed for these professionals.
See how much roof data your county really has
Start a free trial, open your county, colour it by roof age and judge the coverage for yourself.
Start free trial