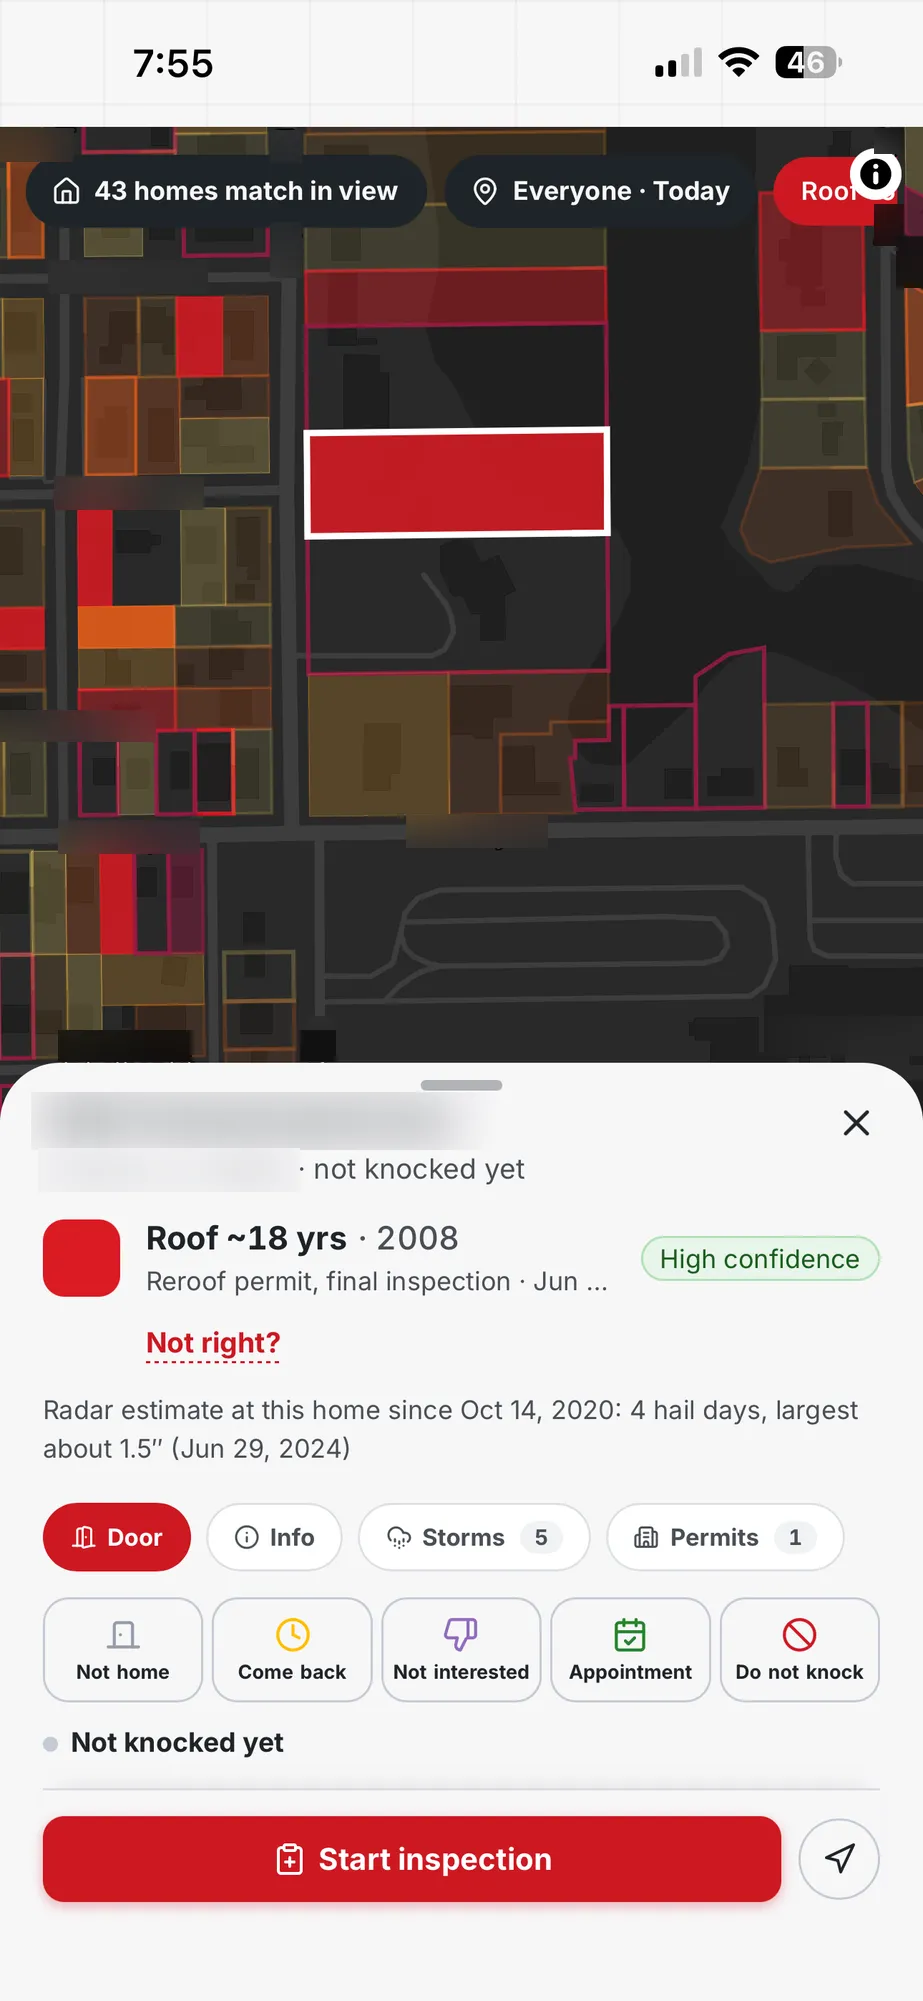
A crew with an open Saturday does not need every address in a county. It needs a short list of streets where a conversation at the door makes sense, and the cheapest first cut on any street is the age of the houses on it.
Year built is the fullest date we hold. In Florida it is present for roughly four homes in five, and in Texas for about half. That coverage is the reason the first filter in our worked example is a build-year band and not a roof date. A date that exists for most homes can anchor a search. A date that exists for a small share of homes cannot.
Build year also tells a canvasser something practical. Houses from one development tend to share a roof pitch, a shingle generation and a replacement history, so a band of years groups streets that behave alike. Pick the band your company works best, such as homes older than fifteen years, and the map quietly drops the new subdivisions where a pitch would be wasted.
None of this is a promise about any single roof. A build year narrows where to look. Standing in the yard and looking at the roof is what tells you its condition.
Hail appears in two ways at once. Homes can be coloured by the hail size recorded over them, and the hail swaths are drawn as bands across the territory so you can see where a storm tracked before you read a single number.
The hail filter sets a minimum size. You choose from one inch, one and a half inches, two inches or two and a half inches, and the map keeps only homes at or above it. A separate time window runs from today back through the last three years, so the same click that finds last week's storm can also find the one from the spring before.
The radar-derived hail grid is refreshed daily and reaches back to October 2020. Older storm records exist in the history for individual homes, but the colouring and filtering you use for canvassing rest on the radar record. Hail and wind rows appear in the filter panel only after you switch the matching layer on, which keeps the panel short until you need them.
Wind works the same way, with a minimum speed of fifty, sixty or seventy-five miles an hour. Our ready storm layers today are for Florida and Texas, the same two states that carry house-level data.
Picture a sales manager in north Texas on a Monday after a weekend storm. She opens the map, clicks the build-year chip, sets hail to one and a half inches, and picks the window that reaches back to the weekend storm. The map thins out to a handful of corridors, and the count in the corner tells her roughly how many homes sit inside the view.
She zooms to the three corridors with the densest matches, draws a territory around each, and assigns them to three reps before the morning huddle. Each rep opens the app in the phone browser and sees only their own territory, with the matching homes already marked.
By noon she can see where her people are standing, which doors answered, and which addresses were marked do not knock. The afternoon plan is no longer a guess about who covered what. It is a look at the pins.
The same sequence works for an owner-operator with one truck. The map just replaces the clipboard, and the territory is a single block instead of three.
Roof age is a real filter on the map, set at five, ten, fifteen or twenty years. Two permit filters sit beside it: one for homes that have a roof permit on record, and one for homes whose roof date comes from a permit.
The limit is coverage. Roof dates come from permit records, and today they exist for a small share of homes. A search that leads with roof age would quietly skip the large majority of houses simply because the date is missing, which is why this page does not lead with it.
Permits themselves are broader than roof dates. The map holds over 10 million permit records across Florida and Texas, and the per-home panel lists them with the storm history. A permit that shows a recent replacement is a good reason to move a house down the list. A long gap with no permit is a reason to look closer.
Use roof age as a second pass. Start with build year and hail, then add the roof-age chip to see which of those homes also have a dated roof past a certain age. Treat the result as a shorter list and not as the full list.
A territory is a drawn area on the map with a name and an owner. You draw it around the streets that matched your filters, assign it to a rep or a team, and from then on that area belongs to them in the app.
Because the knock pins and the territories live on the same map as the hail layer, a manager can check coverage visually. A territory with many pins and a few matching homes left is nearly done. A territory with no pins at midday is a phone call.
Teammate locations appear on the map as well, so the person assigning work can see who is closest to a new lead from a callback. When several crews work one city, the territory boundaries do the job a whiteboard used to do, and they update the moment someone changes them.
Every door gets one of four outcomes: not home, come back, appointment, or do not knock. A pin is dropped at the address, so the next rep sees the history before reaching the porch.
Do-not-knock is a hard stop, not a note. An address marked that way stays marked for the whole team, which protects the homeowner's wishes and keeps your crew from repeating a visit that was already declined.
Appointments flow into the team view, so a booked inspection is visible to the person who will perform it. Prospect lists collect the homes you want to revisit, and an address-only export lets you move a list into another system without carrying anything extra with it.
Contact details are entered by the rep at the door. The map does not supply phone numbers or email addresses for homeowners.
When a homeowner says yes, the inspection starts from the knock. The address, the storm history and the permit list are already attached, so the inspector arrives with the context rather than looking it up on the driveway.
Photos taken during the inspection feed the report. A report needs a Pro seat, and each paid Pro seat adds standard reports each month that are shared across the company, as the price block on this page states.
The report documents what the inspector photographed and measured. It does not interpret policy terms, and it does not predict what anyone's insurer will do. The only sentence on that subject is this one: Contact your insurance company to verify coverage, deductible and policy terms.
Because the knock, the inspection and the report share one record, a manager can open a home and see the whole sequence: who knocked, what the door said, what the photos showed, and what the homeowner received.
House-level data is live in Florida and Texas only. Georgia, Alabama and Tennessee are next, and Louisiana and Oklahoma come after that. If you work outside the two live states, the map will not show homes there yet.
There is no typed or spoken search. The search box finds an address, a city or a ZIP code. Everything else is a click on a filter. Live storm tracking is marked as coming soon in the product, there is no storm alert feed, and the map does not plan a driving route between doors.
Roof material, roof shape and home value filters exist only in some counties. Owner names appear in some Texas counties, from public records.
A store app is coming soon. Until then the map runs in your phone's browser, and you can add it to your home screen so it opens like an app.
The map and canvassing come with a Basic seat. The Basic seat is $32.50 per user per month on the yearly plan billed monthly, which is a 12-month plan, or $39 per user per month when you pay month to month.
A Pro seat is $79 per user per month when billed month to month, and it adds reports. For a five-person crew on Basic seats billed monthly on the yearly plan, the total is $162.50 a month.
There is no price by state. A seat costs the same whether you canvass in Florida, Texas, or both. The pricing page lists every plan and term, and the price cards above read from the same list.
It suits the owner-operator who wants a smaller list of streets after a storm, and it suits the sales manager who needs to see twelve people and their territories at a glance. The same filters serve both, and the seat price is per person.
It also suits crews that already take inspection photos. Because the inspection starts from the knock, the photos you were going to take anyway turn into the homeowner report with a Pro seat, and nothing is typed twice.
If your work is mainly outside Florida and Texas, wait for your state to be added or use the comparison pages to weigh the alternatives. We would rather you choose with the coverage in front of you.